

A creative can earn strong survey feedback and still fail at the shelf, in a feed, or on a landing page because the brand, offer, or call to action was never actually seen. That is why teams ask: are gaze metrics reliable enough to guide a real business decision?
The practical answer is yes, when the metric matches the research question and the study is designed to manage data quality. But reliability does not mean every individual gaze point is perfect, or that every project needs lab-grade spatial precision. It means the data produces sufficiently consistent, interpretable patterns to support the decision at hand.
For many remote UX, advertising, packaging, and media studies, the most useful question is not whether a participant looked at pixel X, Y at a precise millisecond. It is whether people noticed a key element, how quickly they found it, how long attention remained there, and what competed for attention. Those are questions gaze metrics can answer well at scale.
What reliability means for gaze metrics
Reliability and validity are related, but they are not the same thing. Reliability asks whether a measurement is consistent. If similar participants complete the same task under similar conditions, do the results show a comparable pattern? Validity asks whether the measurement represents what researchers claim it represents. A reliable measure can still be unhelpful if it is used to answer the wrong question.
With eye-tracking, reliability has several layers. The system must estimate where a person is looking with reasonable consistency. Participants must complete calibration successfully and maintain acceptable tracking quality. Finally, the analysis must aggregate individual observations into a meaningful group-level result.
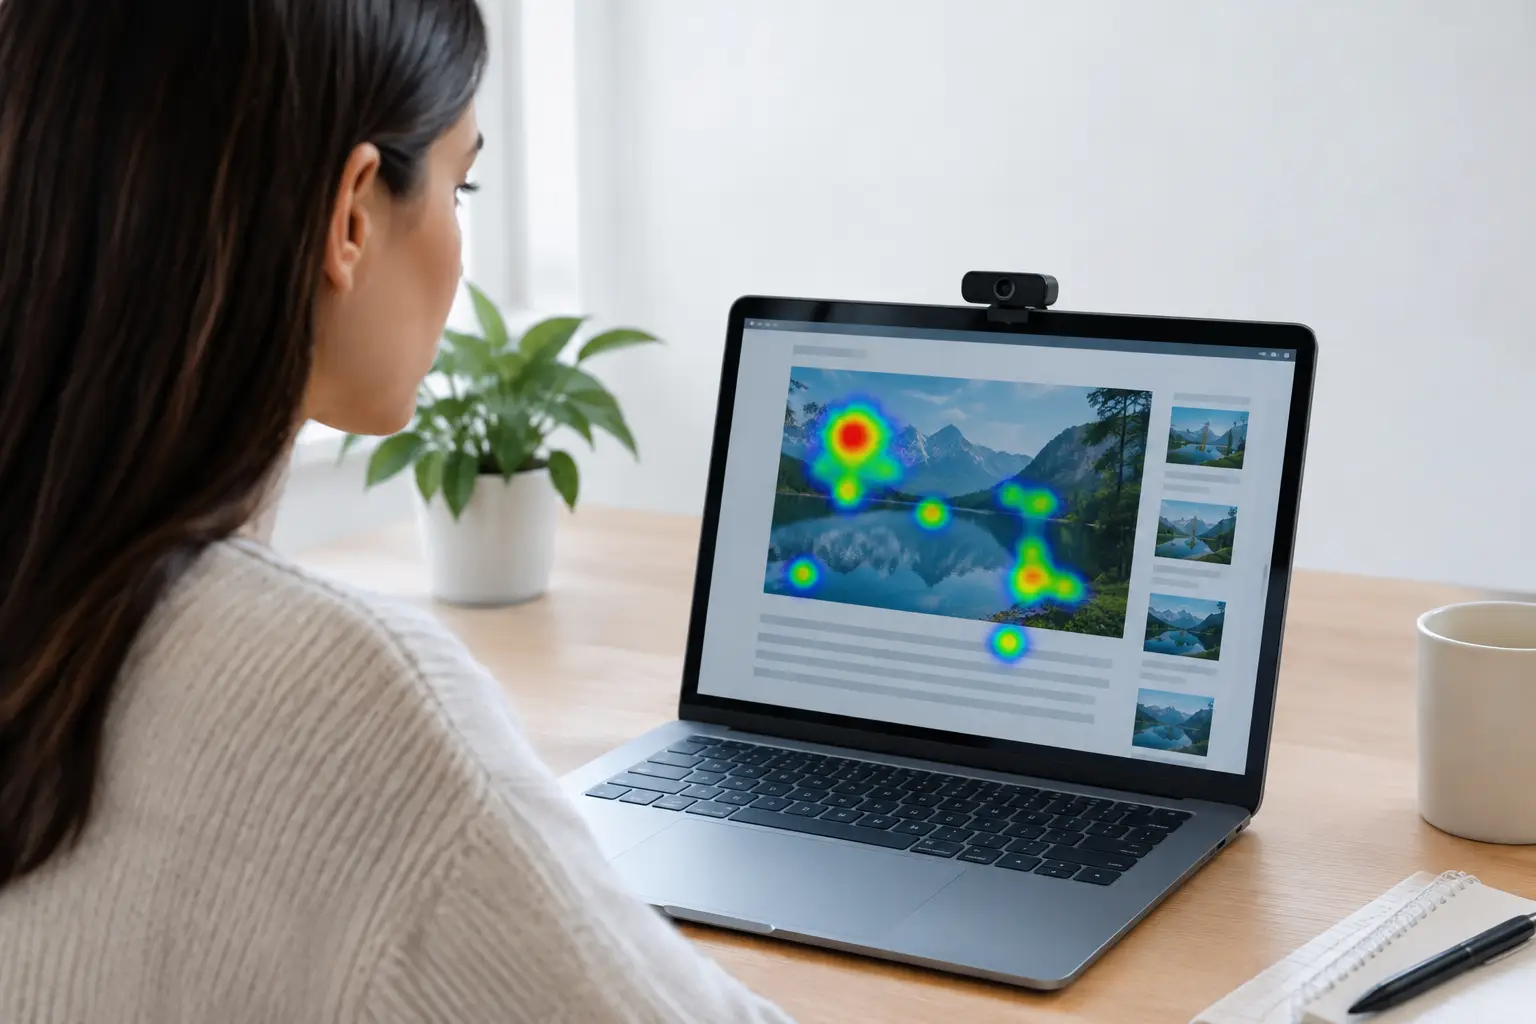
This is why a heatmap alone should not carry an entire finding. It is an effective visual summary, but researchers should pair it with defined areas of interest and metrics such as time to first fixation, percentage of viewers who saw an element, dwell time, revisits, and fixation count. Together, these measures make it easier to distinguish a compelling pattern from a visually interesting artifact.
Are gaze metrics reliable in webcam-based studies?
Webcam-based eye-tracking is especially well suited to questions about relative attention. It can show whether a price was noticed before a product benefit, whether users find navigation labels, whether an ad logo receives attention, or whether a packaging claim is hidden by competing visual elements.
It is not a replacement for every specialized lab setup. Hardware eye trackers may be the better choice when a study requires highly precise point-of-gaze coordinates, very small targets, advanced clinical measurements, or tightly controlled physical environments. Screen size, camera quality, lighting, participant posture, and head movement can all affect the precision of webcam-based measurements.
That trade-off is often acceptable because remote research offers benefits that matter to commercial and academic teams: faster fieldwork, broader recruitment, natural-device behavior, and larger samples without bringing every participant into a lab. For a website usability study, participants using their own laptops may provide more realistic behavior than participants seated in an unfamiliar research facility.
The key is to avoid applying webcam data to questions that require a different level of precision. If a button is large and visually distinct, measuring whether it was noticed is realistic. If two labels sit a few pixels apart, drawing conclusions about which individual word received more attention may not be.
The metrics that tend to support confident decisions
Some gaze metrics are more dependable than others because they are less sensitive to small variations in estimated gaze position. The strongest choices usually connect directly to a decision.
Visibility and reach show whether a meaningful share of participants looked at an area of interest at all. This is particularly useful for logos, warnings, prices, product claims, and calls to action. If only a small portion of participants ever sees a critical message, the design needs attention regardless of minor differences in fixation duration.
Time to first fixation helps assess discoverability. It is valuable when a user must quickly find a search field, key navigation item, promotional offer, or product detail. Use it carefully alongside task completion, however. Fast attention does not automatically mean clear comprehension or a positive experience.
Dwell time and fixation count reveal sustained or repeated attention. These measures can indicate engagement, but they can also signal confusion. A long dwell time on a shipping policy might mean participants found it persuasive, or it might mean the copy was difficult to understand. Pair gaze data with survey responses, task outcomes, mouse behavior, or follow-up questions before assigning meaning.
Attention sequence can be revealing when order matters. For example, an ad may need viewers to notice the product first, then the benefit, then the brand. Sequence findings work best when researchers define the desired viewing path before reviewing the data, rather than searching for a story after the fact.
Design choices that improve data quality
Reliable results begin before recruitment. A well-configured study gives participants a fair chance to calibrate and makes later analysis more defensible.
First, create areas of interest that reflect how people perceive the stimulus. Areas should be large enough to represent meaningful design elements and should not overlap unless there is a clear analytical reason. For a product page, separate the product image, price, primary benefit, ratings, and purchase control. Do not create an area for every decorative detail simply because the software allows it.
Second, give participants a clear task. Open viewing can be appropriate for creative testing, but it produces more variable behavior. Task-based research - such as finding a return policy, choosing a product, or identifying the advertised offer - makes attention patterns easier to interpret. The task should mirror a real decision without telling participants exactly where to look.
Third, allow enough exposure time. A five-second ad test and a two-minute product comparison are different research situations. Short exposures can reveal first impressions and message pickup. Longer sessions can evaluate navigation, comprehension, and sustained consideration. The metric should match the exposure period.
Fourth, use built-in quality checks and establish exclusion rules before reviewing outcomes. Check calibration performance, tracking quality, completion time, technical compatibility, and whether participants followed instructions. Removing poor-quality sessions is not a way to improve a preferred result. It is a defined quality-control process applied consistently across all participants.
Sample size matters more than a perfect-looking heatmap
Individual gaze behavior is naturally variable. One participant may inspect every word. Another may make a quick decision based on imagery and prior familiarity. A single fixation plot can be useful for diagnosing an experience, but it should not be treated as a population finding.
As sample size grows, group-level patterns become more stable. The right number depends on the decision, audience diversity, number of concepts, and expected size of the difference. A focused UX diagnostic may generate useful direction with a modest sample, while a high-stakes creative comparison requires enough participants to separate meaningful differences from normal variation.
Segmentation also needs discipline. Looking at results by age, device, customer status, market, or campaign exposure can be valuable, but every subgroup reduces the number of observations. If a segment is too small, report it as directional rather than definitive. The same caution applies to comparing many areas of interest at once. More comparisons increase the chance of finding a difference that does not repeat.
Interpret attention in context, not in isolation
Gaze metrics explain where attention went. They do not independently explain why it went there or whether the outcome was positive. A bold warning may attract immediate attention but weaken purchase intent. A familiar logo may receive little dwell time because viewers recognized it instantly. A participant may not look directly at a design element yet still perceive it through peripheral vision.
The most defensible studies combine gaze evidence with complementary behavior and stated feedback. Task success can confirm whether attention helped users act. Survey questions can test comprehension, recall, preference, and intent. Mouse and key tracking can add useful context in desktop experiences. Emotion measures may help teams understand whether a highly viewed element created interest, friction, or concern.
This combined approach also prevents a common mistake: treating more attention as automatically better. The best design is not always the one that holds the gaze longest. It is the one that directs attention to the right information at the right moment and helps people make the intended decision with confidence.
A practical standard for trustworthy remote results
A reliable gaze study has a clear decision behind it. It uses realistic stimuli, tasks that fit the research objective, sensible areas of interest, defined quality thresholds, and a sample large enough for the claims being made. It reports patterns with appropriate caution, especially when differences are small.
Platforms such as RealEye make this workflow accessible by bringing browser-based study creation, remote participant collection, calibration, attention analysis, surveys, and exports into one research environment. That accessibility should not lower research standards. It should make sound measurement practical for more teams and more decisions.
When evaluating gaze findings, ask one final question: would this pattern change what the team designs, says, prioritizes, or tests next? If the answer is yes, and the evidence is supported by clean data and relevant behavioral context, the metric is doing exactly what reliable research should do - reducing uncertainty before a costly decision is made.